
Visualizing Data: A Beginner's Guide to Infographics
(11 min. read)

Table of Contents
- What is an infographic?
- What are infographics used for?
- What are the benefits of using infographics on your website?
- 7 types of infographics
- Commonly used tools to create infographics
- How to make an infographic?
- Examples of effective infographics
- Tips for creating effective infographics
In today’s guide, we will discuss the basics of infographics and how to create them, as well as some best practices and tips for designing effective infographics.
What is an infographic?
An infographic is a visual representation of information, data, or knowledge. It is designed to convey complex information in an easy-to-understand and visually appealing way. Infographics can take many forms, such as bar charts, line graphs, pie charts, diagrams, and more. They can be used to compare and contrast data, show trends over time, highlight key points, or tell a story.
Infographics are not just limited to data visualization; they can also be used to convey information and knowledge on a variety of subjects. For example, an infographic can be used to explain a complex process, provide instructions, or showcase a product. The possibilities are endless, and infographics are a versatile tool for visual communication.
What are infographics used for?
Infographics are used for a variety of purposes, both in personal and professional settings. One of the most common uses for infographics, as we already mentioned, is data visualization. Infographics are commonly used to visualize complex data sets, such as statistics, survey results, or market research data. By presenting data in a visual format, infographics make it easier for the audience to understand and interpret the information.
Infographics can also be used as educational material. Infographics are often used in educational settings to convey information on a variety of topics. They can be used to explain complex processes, provide historical context, or illustrate scientific concepts.
Infographics are also a popular tool in marketing and advertising, as they can be used to showcase products or services, highlight features and benefits, or provide customer testimonials. Since infographics make for very shareable content, they are often used on social media platforms to share news, promote a cause, or provide helpful tips and advice.
What are the benefits of using infographics on your website?
Infographics have many benefits over plain text or tables when it comes to visualizing data, including:
- They are visually appealing: Infographics use color, shapes, and imagery to make data more engaging and interesting to look at. Visuals are easier to remember than text alone, and infographics combine text and visuals in a way that makes information more memorable, leading to increased retention and recall.
- They make data easier to understand: Infographics can break down complex information into digestible chunks, making it easier to comprehend and retain. They can help to capture the attention of the audience and encourage them to explore the content in more detail.
- They are versatile: Infographics can be used for a variety of purposes, from educational material to marketing and advertising.
- They are time-saving: Infographics can condense large amounts of information into a compact and easy-to-read format. This can save time and effort for both the creator and the audience.
- They can help tell a story: Infographics can be used to highlight key points or tell a story with data, making them a powerful tool for communication.
- Their shareability: Infographics are highly shareable on social media, making them a great tool for content marketing and promotion. By creating visually compelling content, businesses and organizations can increase their reach and engagement on social media platforms.
Overall, infographics offer a range of benefits for communicating information effectively and engagingly, making them a valuable tool for businesses, educators, journalists, and anyone who wants to share information in a visually compelling way.
7 types of infographics
There are several types of infographics that can be used to present information in a visually compelling way. Here are some of the most common types:
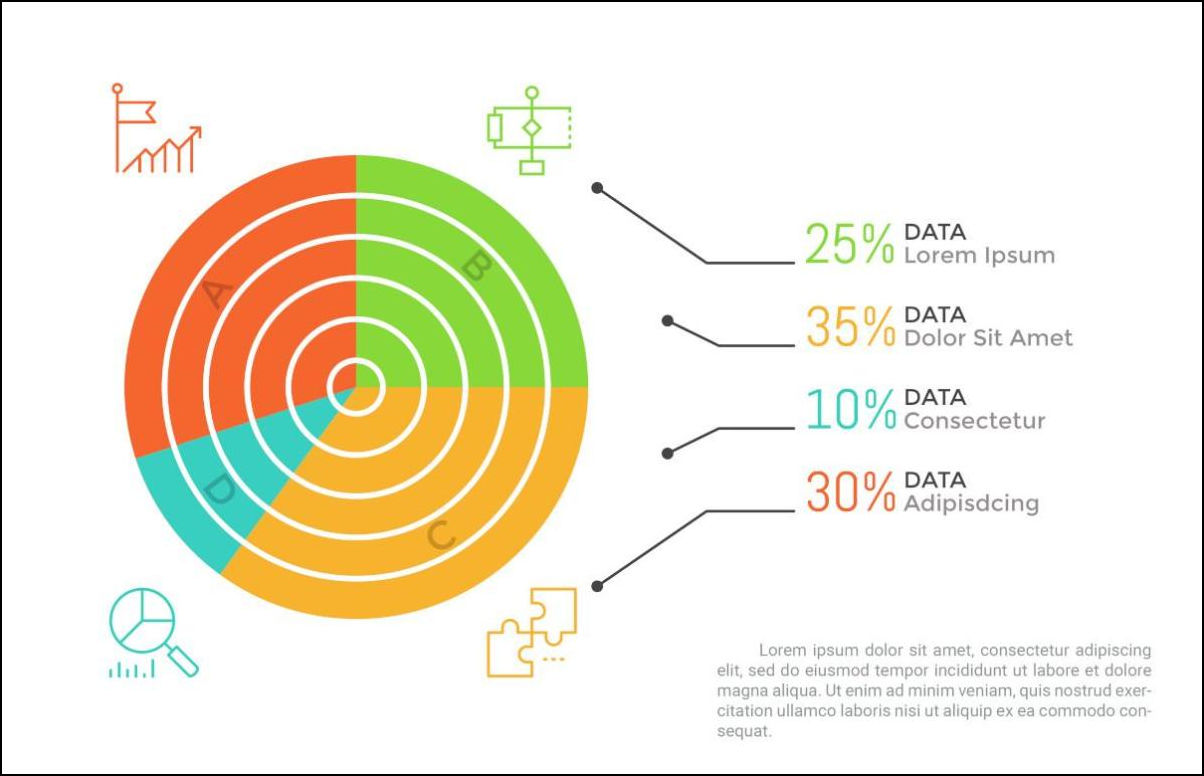
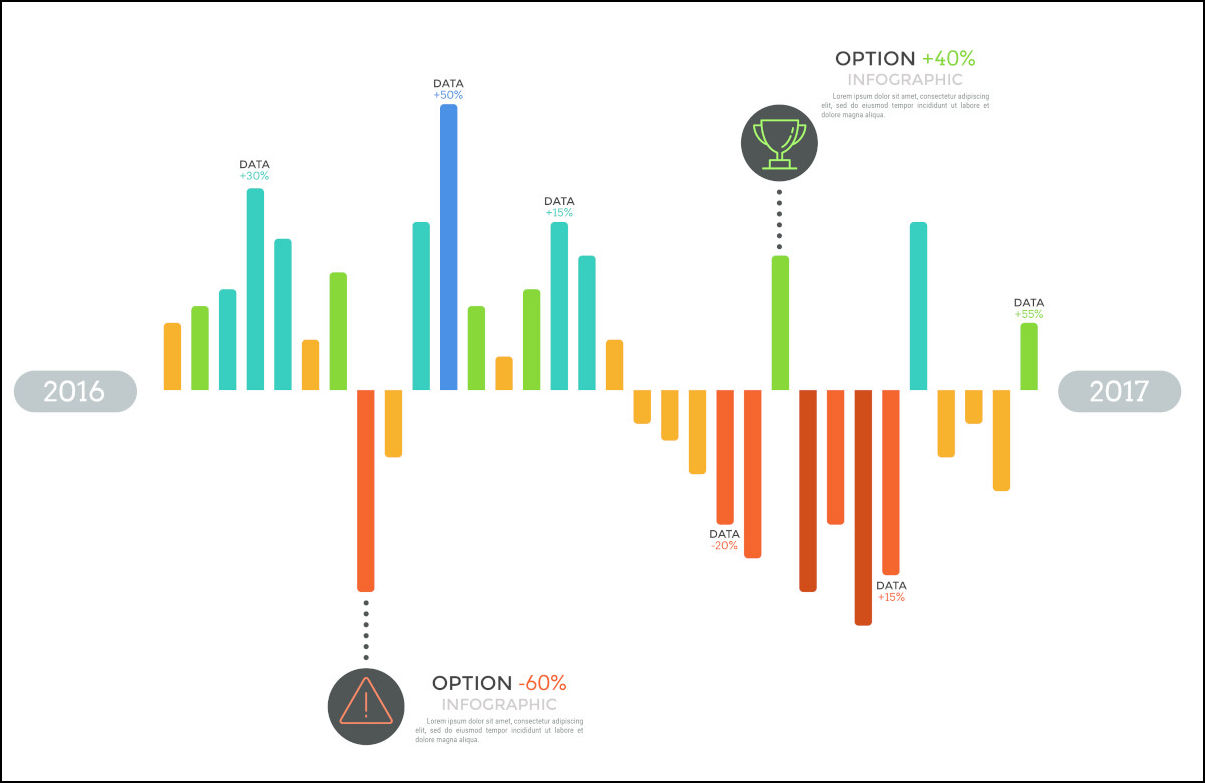
- Statistical infographics: These infographics use charts, graphs, and other data visualizations to present statistical information, such as survey results, market research data, or financial data.
- Informational infographics: These infographics are used to convey information on a variety of topics, from explaining a complex process to providing instructions or showcasing a product.
- Timeline infographics: These infographics use a timeline format to illustrate a sequence of events or historical developments.
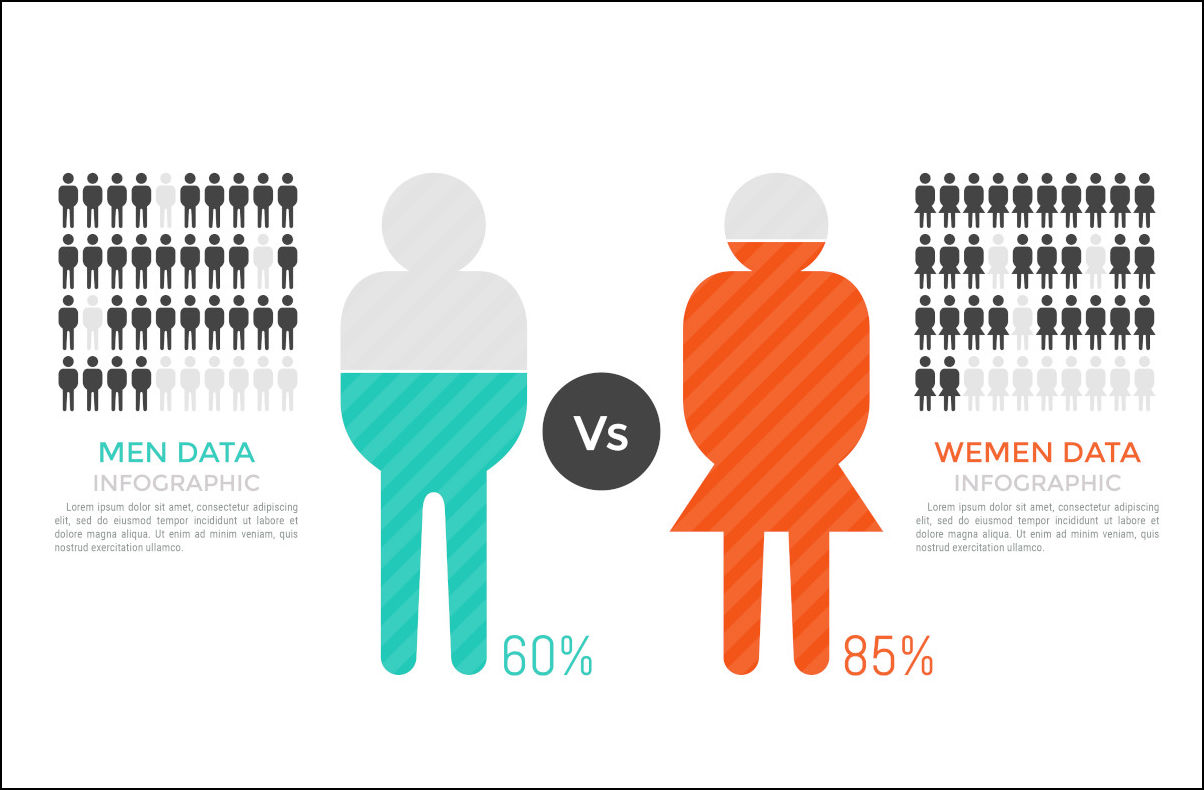
- Comparison infographics: These infographics compare two or more items, such as products, services, or historical events, using visual aids such as charts or tables.
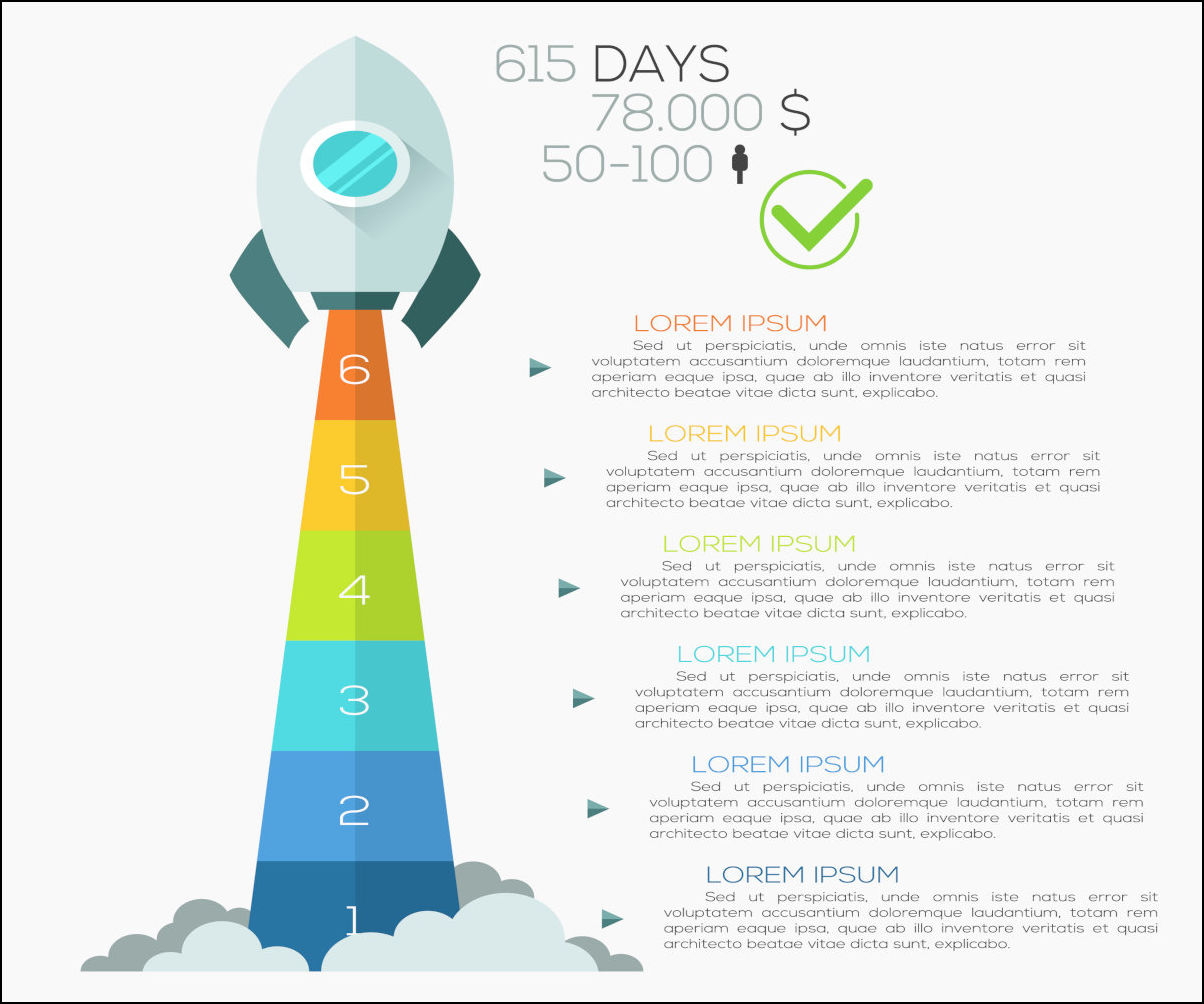
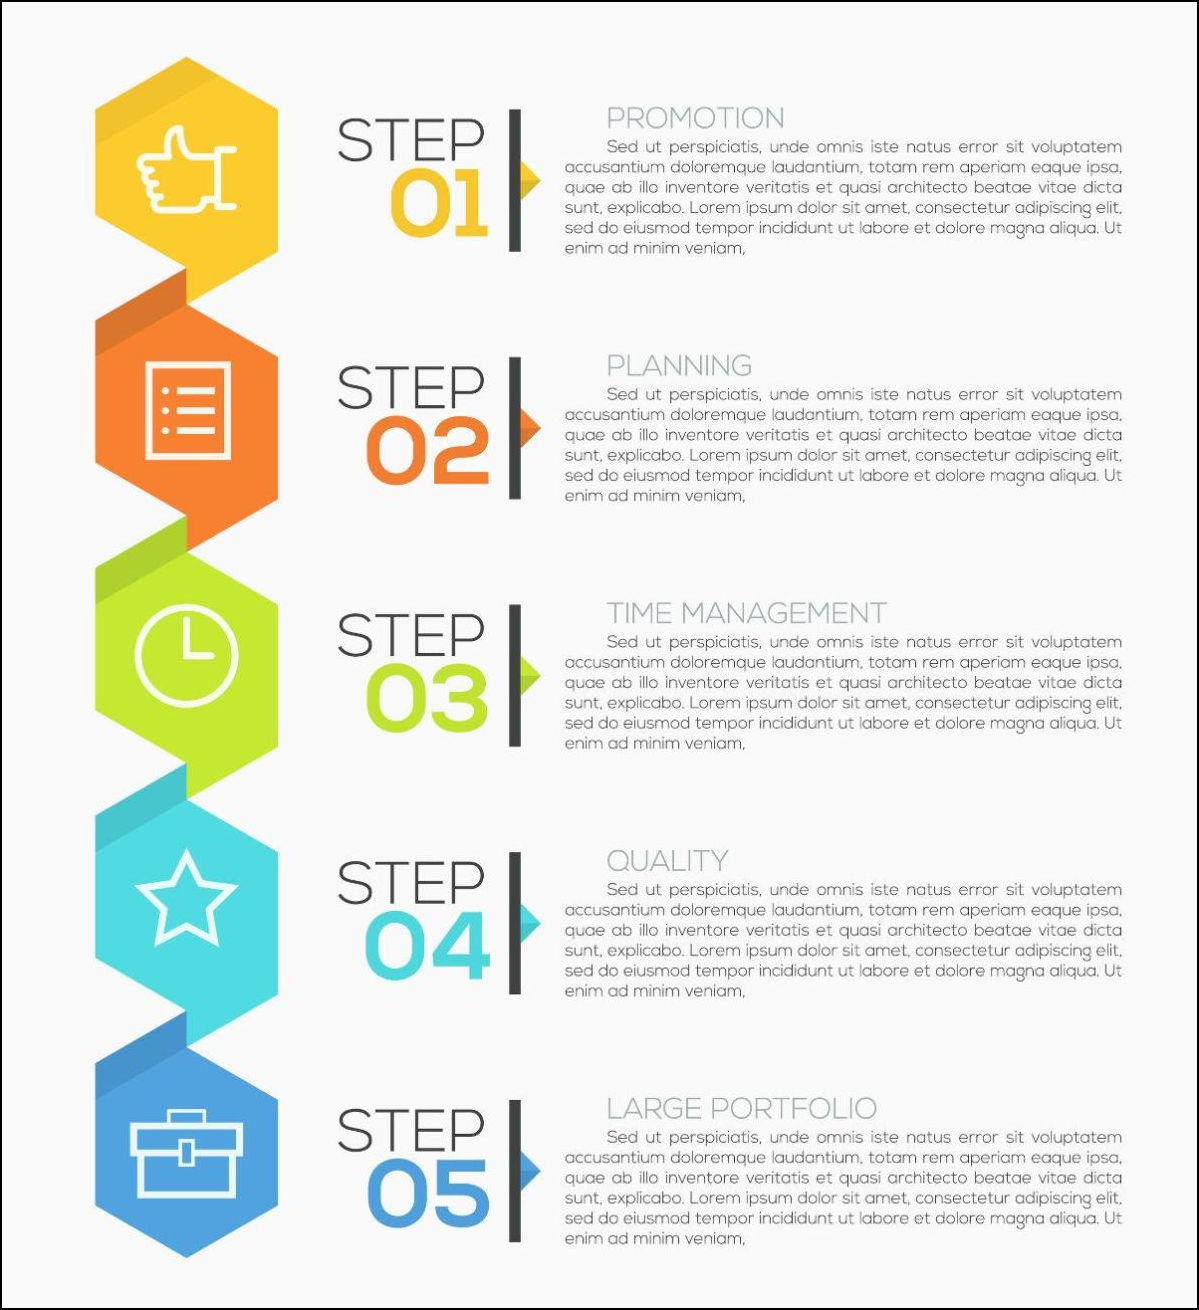
- Process infographics: These infographics use visual aids to explain a complex process or series of steps, such as a manufacturing process or a scientific experiment.
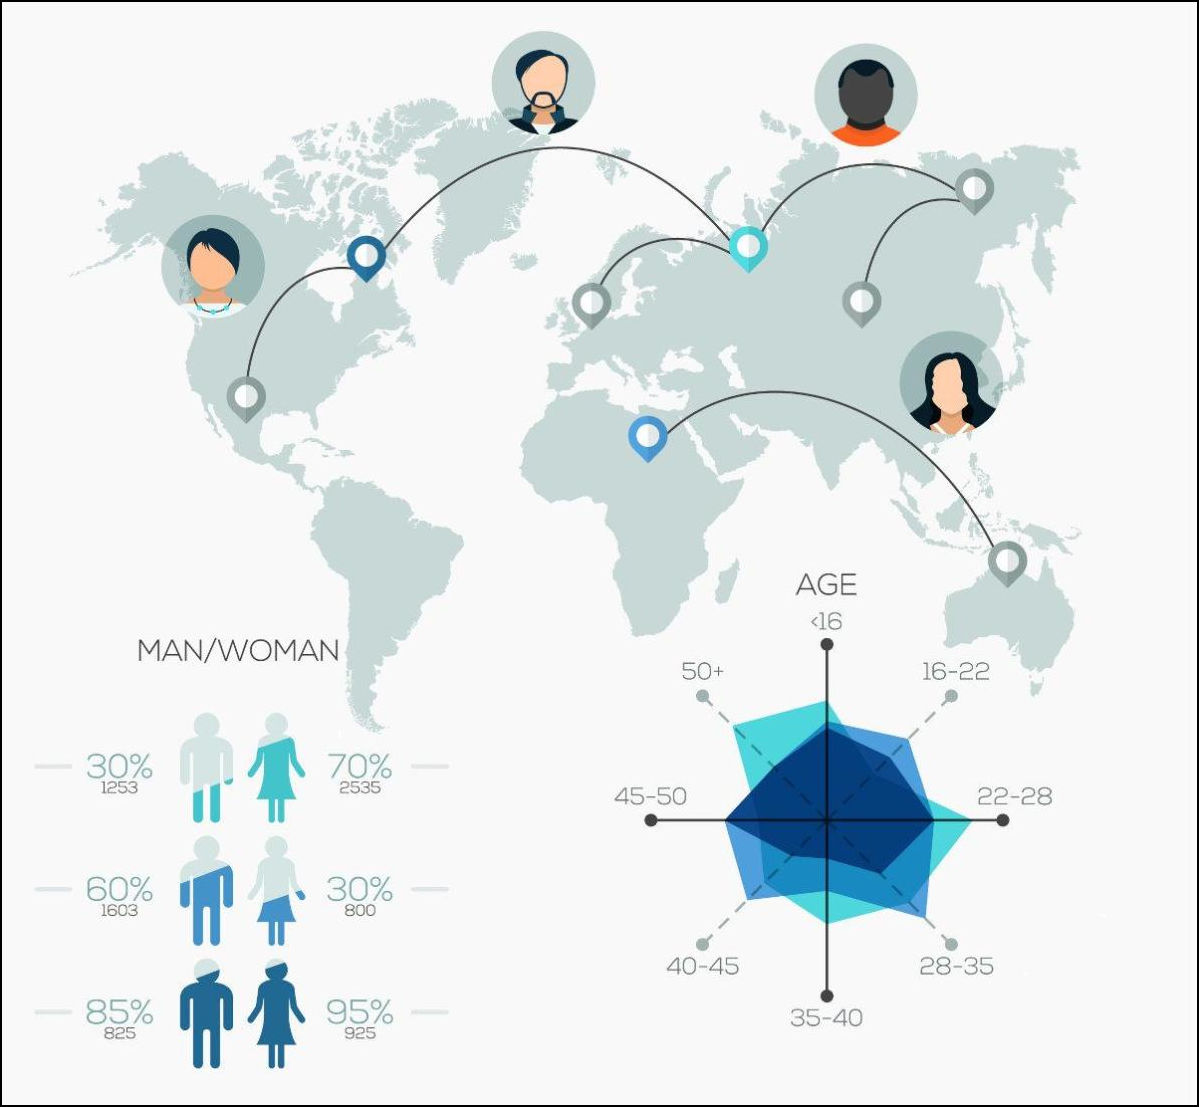
- Geographic infographics: These infographics use maps and other geographic data to illustrate information related to a specific location or region.
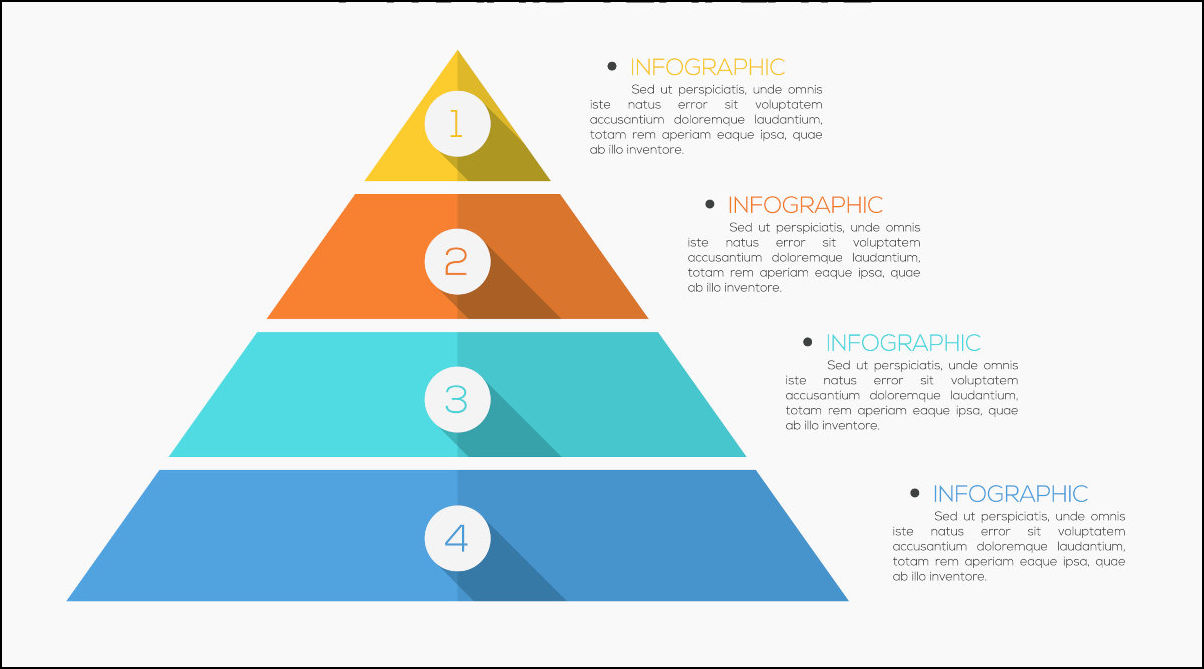
- Hierarchical infographics: These infographics use visual aids such as flowcharts or diagrams to illustrate relationships between different elements, such as a company's organizational structure or a family tree.
There are many different types of infographics that can be used to present information in a way that is engaging, memorable, and easy to understand. With some coding knowledge, you can even create interactive infographics. By choosing the right type of infographic for the information being presented, creators can increase the impact and effectiveness of their visual communication.
Commonly used tools to create infographics
There are several paid tools available used to create infographics, each with its own upsides and downsides. You can order an infographic made by a professional, or use one of these tools to create your own. Some of the most commonly used infographic tools are:
- Canva
- Adobe Illustrator
- Piktochart
- Venngage
- Infogram
- Visme
Free tools for creating infographics
Several of the tools used to create infographics available online are free to use, at least to a limited extent. Canva, for example, is a popular graphic design platform that offers a range of templates and tools to create infographics. Canva's user-friendly interface and extensive library of design elements make it a great choice for beginners and professionals alike. Canva can be used for free, with some of its features locked behind a premium subscription service.
Infogram, Piktochart, Visme, and many other infographic maker applications offer free limited versions of their software as well. If you don't want to spend money but still need an infographic, use a free infographic maker software. You can also use one of the free infographic templates available online.
How to make an infographic?
Designing your own infographic can seem daunting, but it doesn't have to be. With a proper work process, you’ll be surprised how easy infographics are to design. To help you in your endeavors, we’ve prepared a short list of key steps to creating your own custom infographic:
- Determine the purpose: Before you begin designing your infographic, determine the purpose and message you want to convey. This will help you determine what data to include and how to present it.
- Choose your data: Choose the data you want to include in your infographic carefully. Too much data can overwhelm the viewer, while too little can leave out important information.
- Choose your layout: The layout of your infographic should be visually appealing and easy to follow. Consider using a grid system to keep your infographic design organized and aligned.
- Choose your colors: Choose colors that are visually appealing and help to convey the message of your infographic. Be careful not to use too many colors, as this can be overwhelming.
- Choose your typography: The typography of your infographic should be easy to read and complement the design. Use a hierarchy of font sizes to guide the viewer's eye.
- Add visuals: Add visuals such as icons, illustrations, or photographs to make your infographic design more engaging and interesting.
- Create a draft: Use a tool or software to create a draft of your infographic. Most tools and software allow you to choose an infographic template or start from scratch.
- Edit and refine: Once you have a draft, edit and refine your infographic to make sure that it effectively communicates your message. Consider the placement of elements, the use of white space, and the overall flow of information.
- Publish and promote: Once your infographic is complete, publish it on your website or share it on social media. Use relevant hashtags and keywords to promote your infographic and increase its visibility.
5 key elements of an infographic
There are five key elements that every effective infographic should include:
- Visual hierarchy: Visual hierarchy refers to the arrangement of the elements in the infographic in a way that guides the reader's eye through the content. This is usually achieved through the use of size, color, and placement of visual elements.
- Data visualization: Infographics are data-driven, so the effective use of data visualization is essential. This means using charts, graphs, icons, and other visual elements to help readers understand the data.
- Simplified content: The content of an infographic should be simplified and easy to understand. Avoid using jargon or technical terms that may confuse the reader.
- Branding: Infographics should include branding elements such as logos, colors, and fonts that are consistent with your brand. This helps to reinforce brand awareness and recognition. Make branding a part of your infographic design.
- Call to action: A call to action (CTA) is a statement that prompts the reader to take action. This could be anything from visiting a website to signing up for a newsletter. Including a CTA in an infographic can increase engagement and drive traffic to your website or social media channels.
These five elements are crucial in creating an effective infographic. By including them in your design, you can create an infographic that is visually compelling, easy to understand, and drives engagement with your audience.
Examples of effective infographics
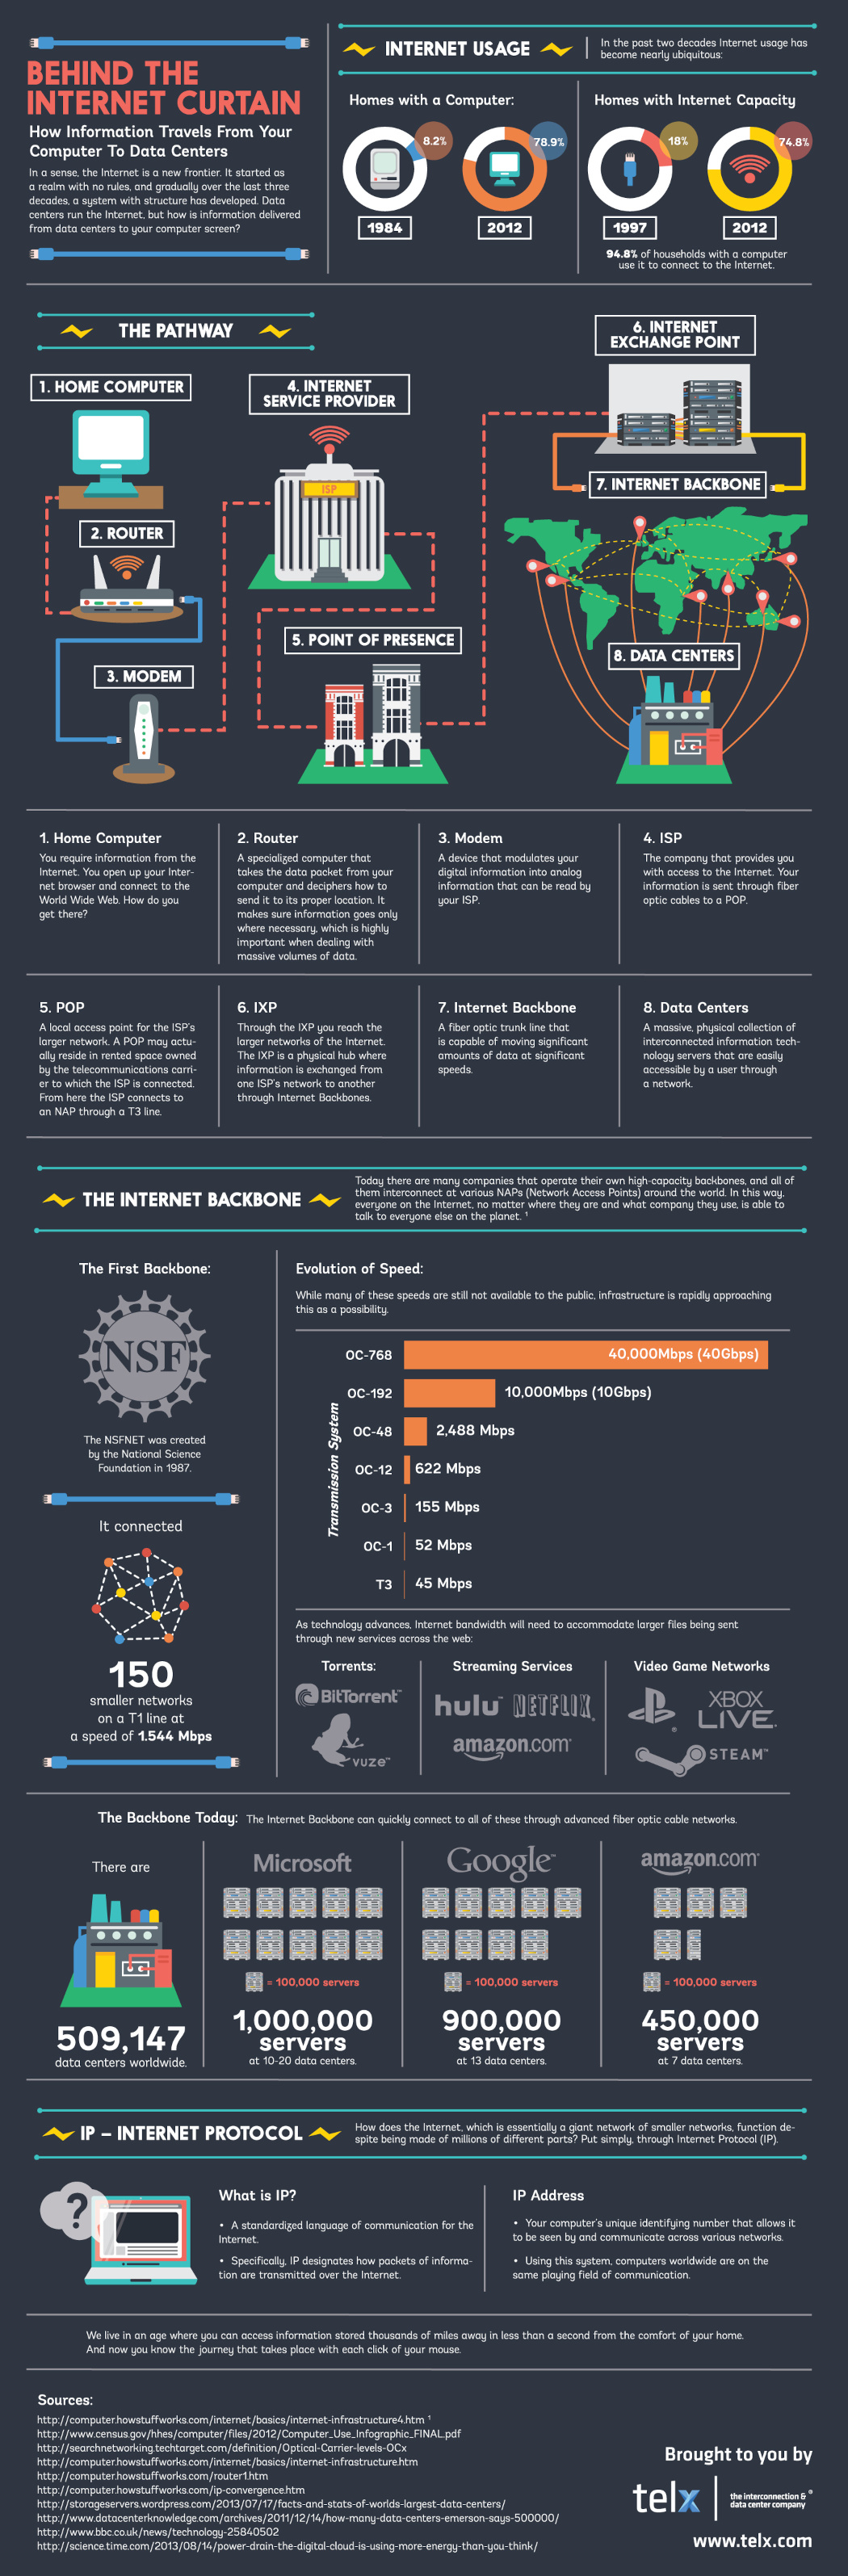
Let’s take a look at this infographic made by Digital Realty (formerly known as Telx), shared as an example of an infographic by Canva:
Source: https://
The title of the infographic is "Behind the Internet Curtain". It gives the reader a good sense of what the infographic will cover. The visual hierarchy is well-designed, with the most important information appearing larger and bolder. The color scheme is dark navy blue and white, which is easy on the eyes and easy to read.
The infographic includes several charts and graphs to present data, including a pie chart, a bar graph, and a line graph. These visual elements make it easy for readers to understand the information presented. The content is simplified and easy to understand. The use of icons and graphics helps to break up the text and make the information more digestible.
Here’s another example of an infographic, created by Flowtown:
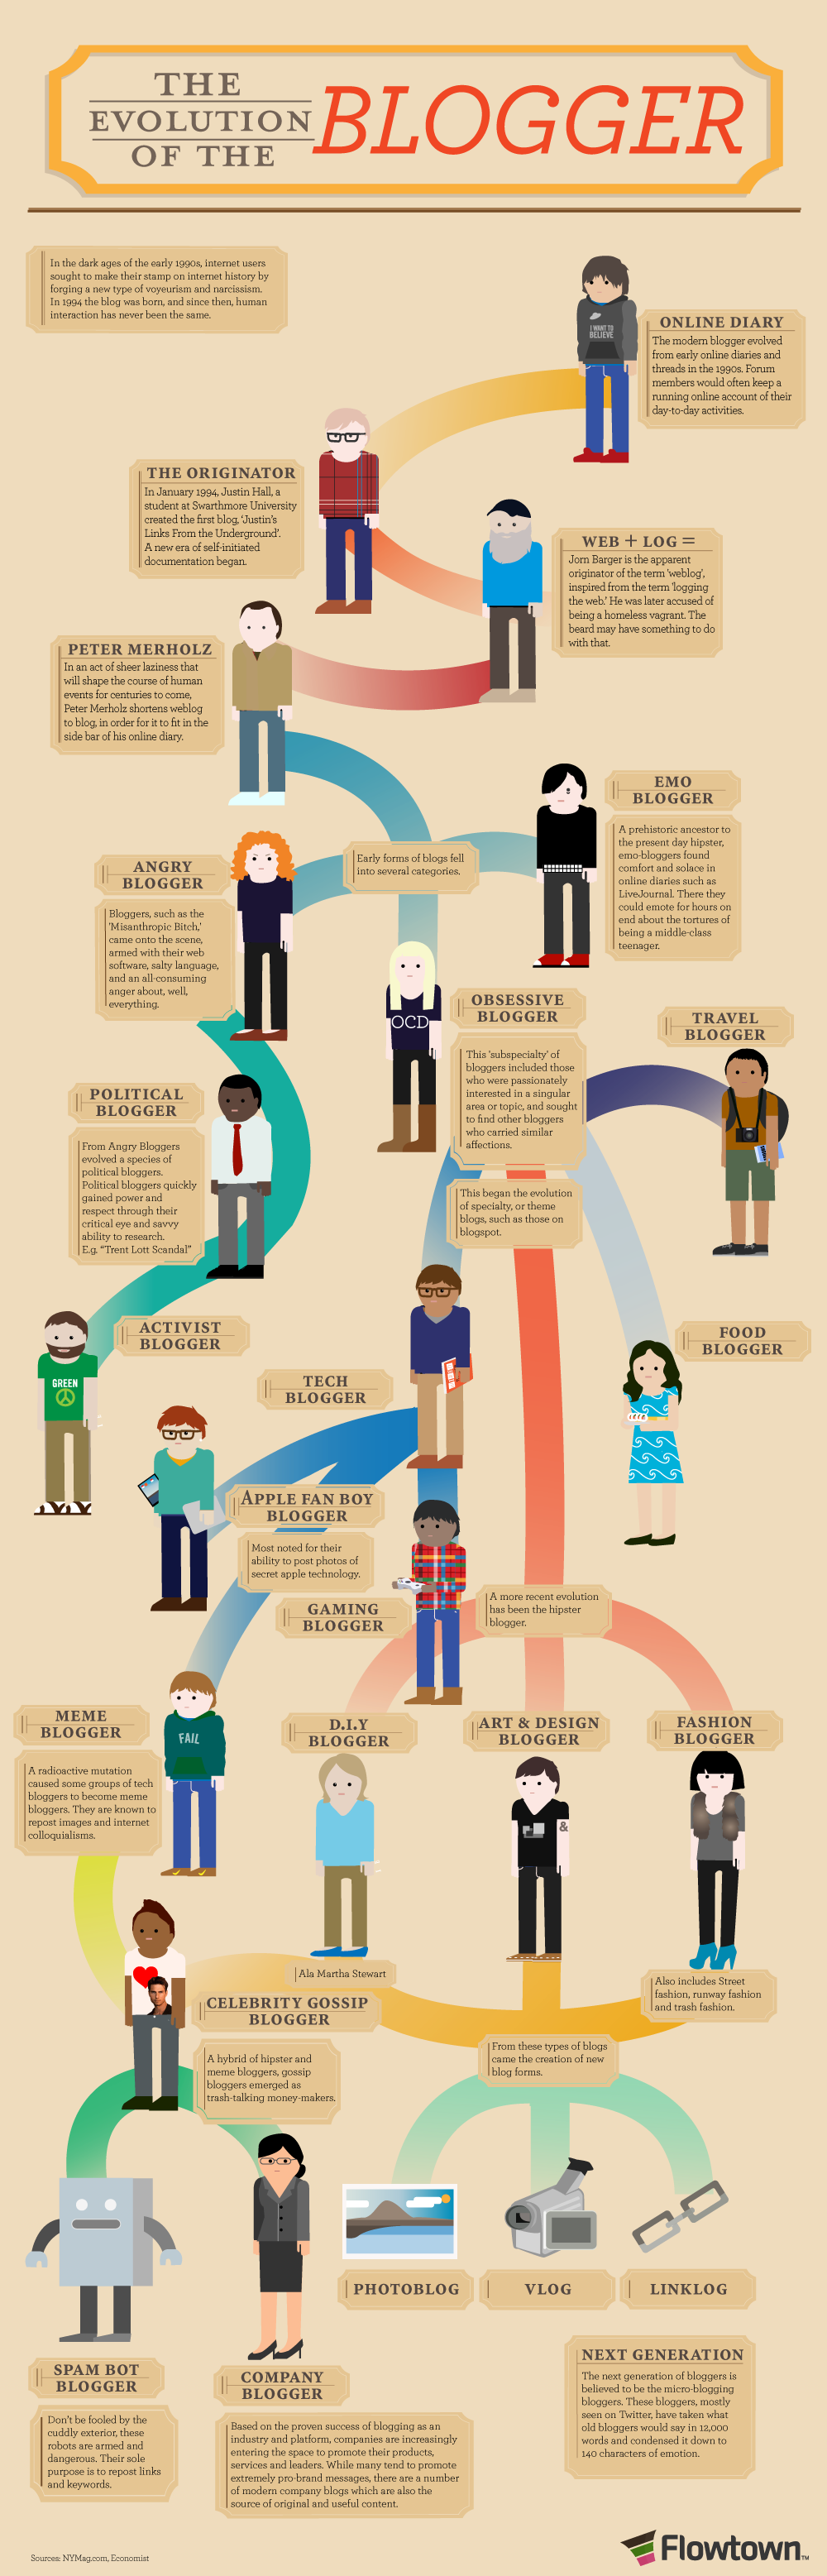
Source: https://
In a very concise and effective way, this infographic portrays the evolution of bloggers, from the early 1990s to the modern day. The infographic uses a warm color scheme that’s easy on the eyes and very readable, and also incorporates icons to visualize the connections between the elements of the infographic. Each blogger type is presented by a well-made graphic, making each of them easily recognizable.
Tips for creating effective infographics
- Define your purpose and audience: Before you start creating your own infographic, you need to define your purpose and audience. What message do you want to convey and who is your target audience? Understanding your audience and their interests will help you create an infographic that resonates with them.
- Choose the right type of infographic: There are several types of infographics, as we discussed earlier, and each type is suited to a different purpose. Choose the type of infographic that best fits your message and goals.
- Keep it simple: The purpose of an infographic is to present information in a simple and easy-to-understand way. Don't overload your infographic with too much information or too many visual elements. Stick to the most important information and use simple visual cues to convey it.
- Use high-quality data and sources: If you're presenting data in your infographic, make sure it's accurate and from a credible source. Use high-quality data to back up your claims and ensure that your infographic is trustworthy, like census data.
- Design with hierarchy in mind: Use visual hierarchy to guide the viewer's eye through the infographic. Place the most important information at the top or in the center, and use larger text or bold colors to draw attention to key points when creating engaging infographics.
- Use visuals effectively: Visual elements such as icons, charts, and graphs are an important part of any infographic. Use them to support your message and make the information easier to understand. But don't overdo it – too many visuals can be overwhelming.
- Choose the right colors: Colors are an important part of any infographic. Choose colors that are easy on the eyes and that complement each other. Use a color scheme that fits your brand and message.
- Make it shareable: Infographics are great for social media and online sharing. Make sure your infographic is easy to share on social media platforms by including social sharing buttons and optimizing the size and format for different platforms.
- Test and iterate: Once you've created your infographic, test it with your audience to see how they respond. Use their feedback to make improvements and iterate on your design.
What makes a good infographic?
A good infographic is one that effectively communicates complex information in a simple and visually appealing way. Clarity is one of the components that makes a good infographic. The information should be presented in a logical order, with a clear beginning, middle, and end.
An effective infographic is also visually appealing and engaging. Using colors, icons, charts, and graphs can help to make the information more interesting and memorable. A good infographic is also relevant to the audience and the topic. Make sure that the information you're presenting is useful and interesting to your target audience.