
Free tools for creation of infographics
(5 min. read)

Table of Contents
- Infographics - an attractive way of presenting content
- Piktochart
- Infogram
- Easel.ly
- Visual.ly
- Summary
Infographics - an attractive way of presenting content
Infographics are one of the best ways to get quality links from multiple sources. The main factors in their success (meaning a large quantity of good links and a huge number of shares) are having a great idea and the quality of production. An interesting concept and attractive data presented in infographics won't go viral if they are not readable or are aesthetically unappealing. And vice versa - if you create a beautiful infographic which deals with a boring topic or is full of errors, you won't achieve success. So, let's say you have a topic and the content ready, now you just have to create an infographic that will be engaging. You can use a couple of solutions:
- order an infographic from a freelancer
- order an infographic from a professional agency
- create an infographic yourself using tools available on the web
If you have someenthusiasm and a little sense of style, the last solution is the cheapest.
This article will show you some of the tools you can use to create an infographic for free. I'll describe four pieces of software which are (in my opinion) the best for easy and effective creation of infographics.
Piktochart
When you use Piktochart, you can utilize 4 predefined formats (infographic, report, banner, presentation) to create an infographic. Each format has a couple of templates which can be browsed using a variety of filters, like categories and keywords. Making an infographic is easy, you just drag and drop the chosen elements of the template or add new ones. If you find a template that fits your theme, you just need to add the relevant data. In the case of creating graphs and charts, you can easily import info from an excel spreadsheet or a CSV file. The editor is very user-friendly and if you have used a simple graphics editor (like Windows paint) at least once in your life, you will be able to use Piktochart. Ready infographics can be embedded on the site using a generated code, or downloaded in JPEG or PNG format (although the infographic will be watermarked if you use the free version). You can also share your work through the most popular social media outlets (Facebook, Twitter, Google+, Pinterest).
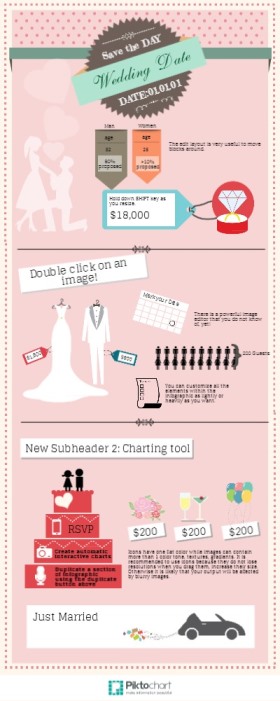
A sample infographic made using Piktochart
Price
- Free version with limited options (a few templates, Piktochart watermark, restricted image upload, low resolution of exported images)
- Pro version - $29/
month or $290/ year
Address:
Infogram
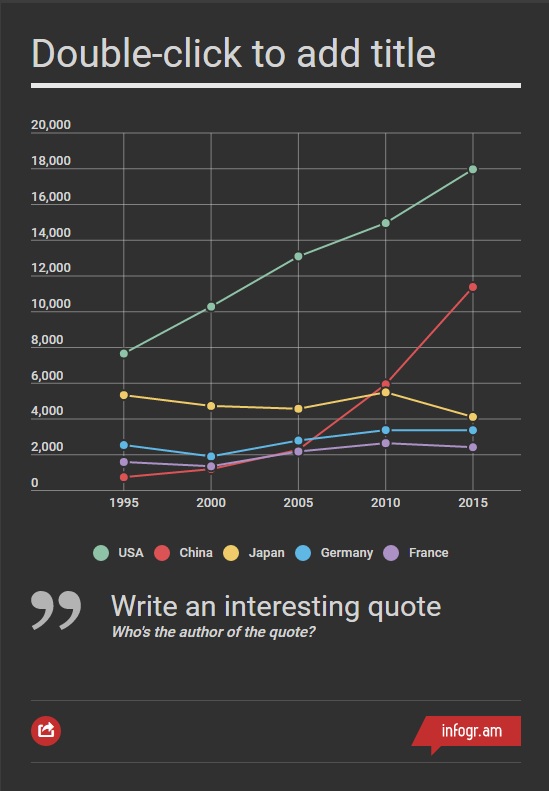
infographics design - Infogram
Registration on Infogram is fast - you just need a Google+ or Facebook account and you can log in with one click. In the free version, you have 6 defined templates to choose from. Most edits are done using simple drag and drop, and you can add ready-made components to your work: charts, maps, text, image and video. Unlike Piktochart, the interface seems less complex and the options are limited. Unfortunately, you can't do much more using the free version - exporting the created infographic to a file is available only in the pro version. Infogram differs from Piktochart mainly in that it gives you a huge variety of charts to choose from, which can be created quickly by importing data from different files. When you use the free version, you can save up to three infographics at one time. Sadly, you cannot save your work as a file, but you can share it using Facebook, Twitter, Pinterest or use the code to embed it on your site (iframe).
Price:
- free version with limited options
- Pro - $19/
month - WhiteLable - $67/
month (the infogr.am logo is not visible and you can upload your own)
Address:
Easel.ly
Making an infographic in Easl.ly starts with the choice of background. You can choose from a dozen different ones that match various infographic styles. The creation process is simple - you put certain elements (grouped in categories, such as people, maps, icons) on the chosen background. The number of objects you can use is huge, and the categories encompass any topic you wish to put on the infographic. Besides ready-made objects, you can also embed shapes and text. Finished work is saved on your account and can be downloaded in JPEG format, or you can receive a direct link to the chosen infographic. Unfortunately, Easel.ly is not capable of creating charts - it is best used to showcase a basic concept. In addition, those using other alphabets cannot use special characters as English is the only font format available.
Price:
-
Free
Address:
Visual.ly
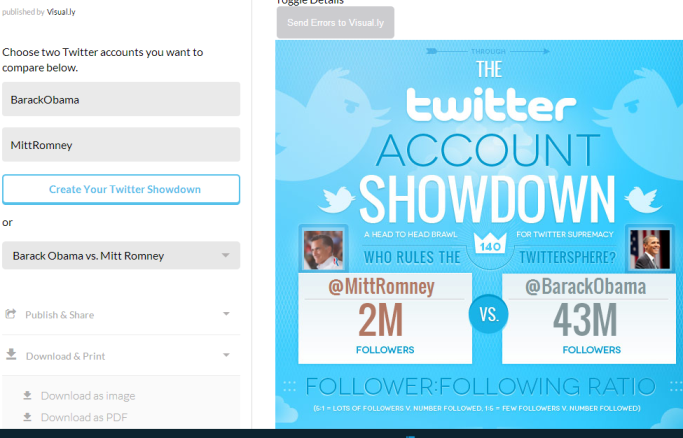
Creating an infographic using Twitter profile data
The authors of this tool have found a different approach to infographic creation. Visual.ly is a social platform for infographics creators. Projects can be rated and commented on by other users. The infographic creation tool is only a bonus, although its capabilities may be sufficient for many people. Social media fans will be the most satisfied with this software as it allows for easy creation of infographics showing a comparison between two Twitter accounts, fan page stats for a Facebook account (only those administered by you) or the most important info regarding a given hashtag. Generating an infographic consisting of a summary of Google Analytics data is also a very interesting option. To make such infographics, you only need synchronization of your Google account with Visual.ly.
Price:
-
Free
Address:
Summary
As you can see, there are some fascinating tools which make it easy to create infographics. Piktochart appears to be the best solution as it has a lot of options, even in the free version. Do you use infographic creation tools? If yes, leave a comment and share your experiences.
Author: Karol Soja